Public Beta

An open platform for understanding Australia’s methane emissions

Open Methane is an online platform for monitoring Australia’s methane emissions using a combination of atmospheric modelling and satellite measurements.

Explore Methane Map
A video clip of a map of Australia divided into grid cells, showing methane emissions.

Open Methane analysis reveals Australia’s top twenty methane hotspots

The early evidence suggests significant underestimation of methane emissions from fossil fuel sites.

Explore the List
Collage of images of grid cells in the Open Methane methane map

Methodology Overview

View Full Methodology
Open Methane methodology - showing all the layers that make up the system
Professor Peter Rayner
Science Lead

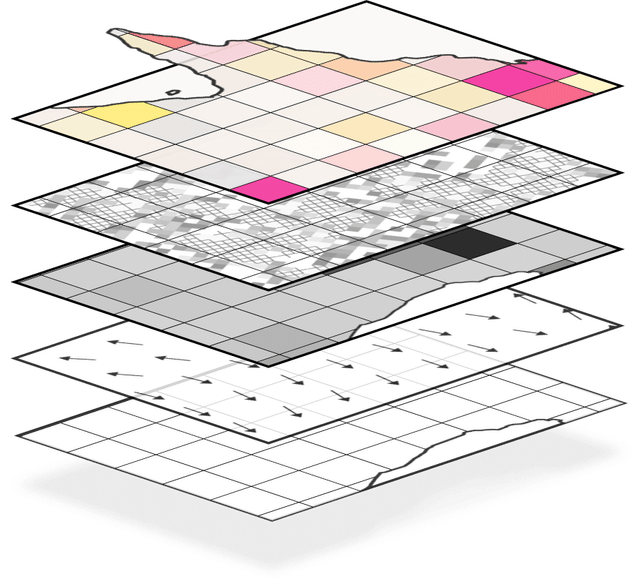
Introducing a new model for improving our view of methane

See an overview of the Open Methane methodology.

Establishing an Initial Estimate of Australia's Emissions

To establish an initial estimate of Australia's methane emissions, we combine data from the Australian Government's National Methane Inventory with land use data and other relevant information.

Incorporating Atmospheric Conditions

Wind speed and direction, as well as atmospheric conditions, influence the distribution of methane throughout the atmosphere.

By employing a Weather Forecast Model (WRF) and Atmospheric Pollution Model (CMAQ), we develop a prediction of methane transportation in the atmosphere.

Calculating Australia's Expected Atmospheric Concentrations

By integrating our Initial Emissions Estimate (Step 1) with the Atmospheric Pollution Model (Step 2), we create a map indicating expected atmospheric concentrations of methane

This visualisation reflects the amount of methane contained in each cubic metre of air across Australia, averaged through the atmosphere.

Gathering Satellite Observations

Satellites equipped with methane-detection capabilities map the methane concentration above each point of Australia. These readings may be influenced by atmospheric visibility issues, such as cloud cover.

Detecting Unexpected Concentrations

Unexpected methane concentrations emerge when comparing satellite-measured atmospheric concentrations (Step 4) against model-produced expected concentration data (Step 3).

Discrepancies highlight anomalies to the initial emissions estimate, and appear as methane 'events' on Open Methane.

Tracing Emissions and Corrections

To pinpoint the emissions corresponding to the concentration discrepancies, we operate the Atmospheric Pollution Model (like in step 3) but in reverse.

Refining the Emissions Estimate

Our corrections yield an improved picture of Australia's methane emissions. These improved estimates can be observed and compared using the Open Methane Map and Data Tool.

View Full Methodology
Overview
Coming Soon

Open Methane — Full Version

Australian methane map

New map features will allow users to search and filter methane emissions by time, places of interest, land use, trends and events.

title

Data visualisation tool

Make your own graphs and visualisations of Open Methane data for easy comparison and communication.

title

Alerts and saved views

Sign up to receive methane event alerts in areas that interest you, and monitor methane activity in specific locations through saved views.

title
Australian methane mapData visualisation toolAlerts and saved views